How to Use Analytics to Improve Your LinkedIn Strategy
Posting content on LinkedIn can often feel like shouting into the void. You spend time crafting what you believe is a valuable post, hit "publish," and then... what? A few likes? A random comment? To truly succeed on LinkedIn, you need to move beyond the "post and pray" method and adopt a data-driven approach.
Understanding your LinkedIn analytics is the key to building a powerful personal brand, generating leads, and establishing authority. It helps you understand what content resonates with your audience, what doesn’t, and how to create more of the content that drives real results. This guide will provide you with a clear framework for using analytics to refine your LinkedIn strategy and turn engagement into opportunities.
1. The Key Metrics That Matter (And What They Really Mean)
LinkedIn provides a range of analytics for each post. It's easy to get lost in the numbers, but a few key metrics tell most of the story.
- Views (Impressions): This is the number of times your post was shown in people's feeds. While a high view count feels good, it's a vanity metric on its own. A post can have high views but low engagement, which might mean your hook was strong but the content itself didn't resonate.
- Reactions (Likes, Celebrate, etc.): This is a measure of agreement or appreciation. It's a good indicator that your content is hitting the right note, but it's a low-effort form of engagement.
- Comments: This is one of the most valuable metrics. Comments signal that your content was thought-provoking enough to inspire a response. High-quality comments that add to the conversation are a sign of deep engagement and a great opportunity for you to build relationships.
- Shares: A share is a powerful endorsement. It means your content was so valuable that someone was willing to share it with their own network. This is a strong indicator that you've created something genuinely useful.
- Profile Views: After you post, do you see a spike in profile views? This is a crucial "bottom-of-the-funnel" metric. It means your content was compelling enough to make someone want to learn more about you.
- Direct Messages (DMs): The ultimate conversion metric. Are people sending you DMs that reference your post? This is a clear sign that your content is not just being consumed, but is actively driving business conversations.
- Social Selling Index (SSI): Your SSI is a score from 1-100 that measures your overall effectiveness on LinkedIn across four pillars. It’s a great high-level metric to track your progress over time.
2. How to Access and Interpret Your Analytics
LinkedIn makes it easy to see how your posts are performing.
- For Individual Posts: Simply go to your post and click the "View analytics" button at the bottom. LinkedIn will show you a breakdown of engagement and, crucially, the demographics of your viewers, including their job titles, industries, and locations. This is incredibly valuable for confirming if you are reaching your Ideal Customer Profile (ICP).
- For Overall Performance: Go to your profile, and under your dashboard, you'll find "Content Analytics." This gives you a high-level overview of your content's performance over time.
How to Interpret the Data:
- High Views, Low Engagement: Your hook was great, but the body of your post didn't deliver. Re-evaluate the value you're providing after the "See more" click.
- High Comments, Low Views: You've hit on a niche, highly engaging topic for a small but dedicated audience. This is great for building a tight-knit community.
- High Shares: You've created a piece of content that is highly tactical, educational, or universally resonant. This is content worth repurposing into other formats.
3. From Data to Decisions: Turning Analytics into Action
Measuring your content is useless if you don't act on the insights. Your analytics should inform every part of your LinkedIn strategy.
Refine Your Content Strategy
- Double Down on What Works: If posts about a certain topic consistently get high engagement, that's your audience telling you what they want more of. Make that topic a core pillar of your content strategy.
- Experiment with Formats: Are your carousel posts outperforming your text posts? Do your short videos get more comments? Use the data to decide which formats to focus on.
Sharpen Your Audience Targeting
- Analyze Your Viewers' Demographics: Are the people seeing your posts the people you want to be seeing them? If you're a sales coach for SaaS AEs, but your posts are mostly seen by marketing managers, you may need to adjust your content and hashtags to better target your ICP.
Optimize Your Profile
- Align Your Profile with Your Best Content: If your most successful posts are about "building a sales pipeline," make sure those keywords are front and center in your LinkedIn headline and "About" section. This creates a cohesive brand and improves your searchability.
4. The Ultimate Conversion: Turning Engagement into Opportunities
Analytics don't just help you create better content; they help you find your next customer. The people who like and comment on your posts are not just passive readers; they are warm leads signaling their interest in the problems you solve.
The challenge is, how do you systematically turn that list of "likers" and "commenters" into real business conversations? Manually reaching out to every person is time-consuming and hard to track.
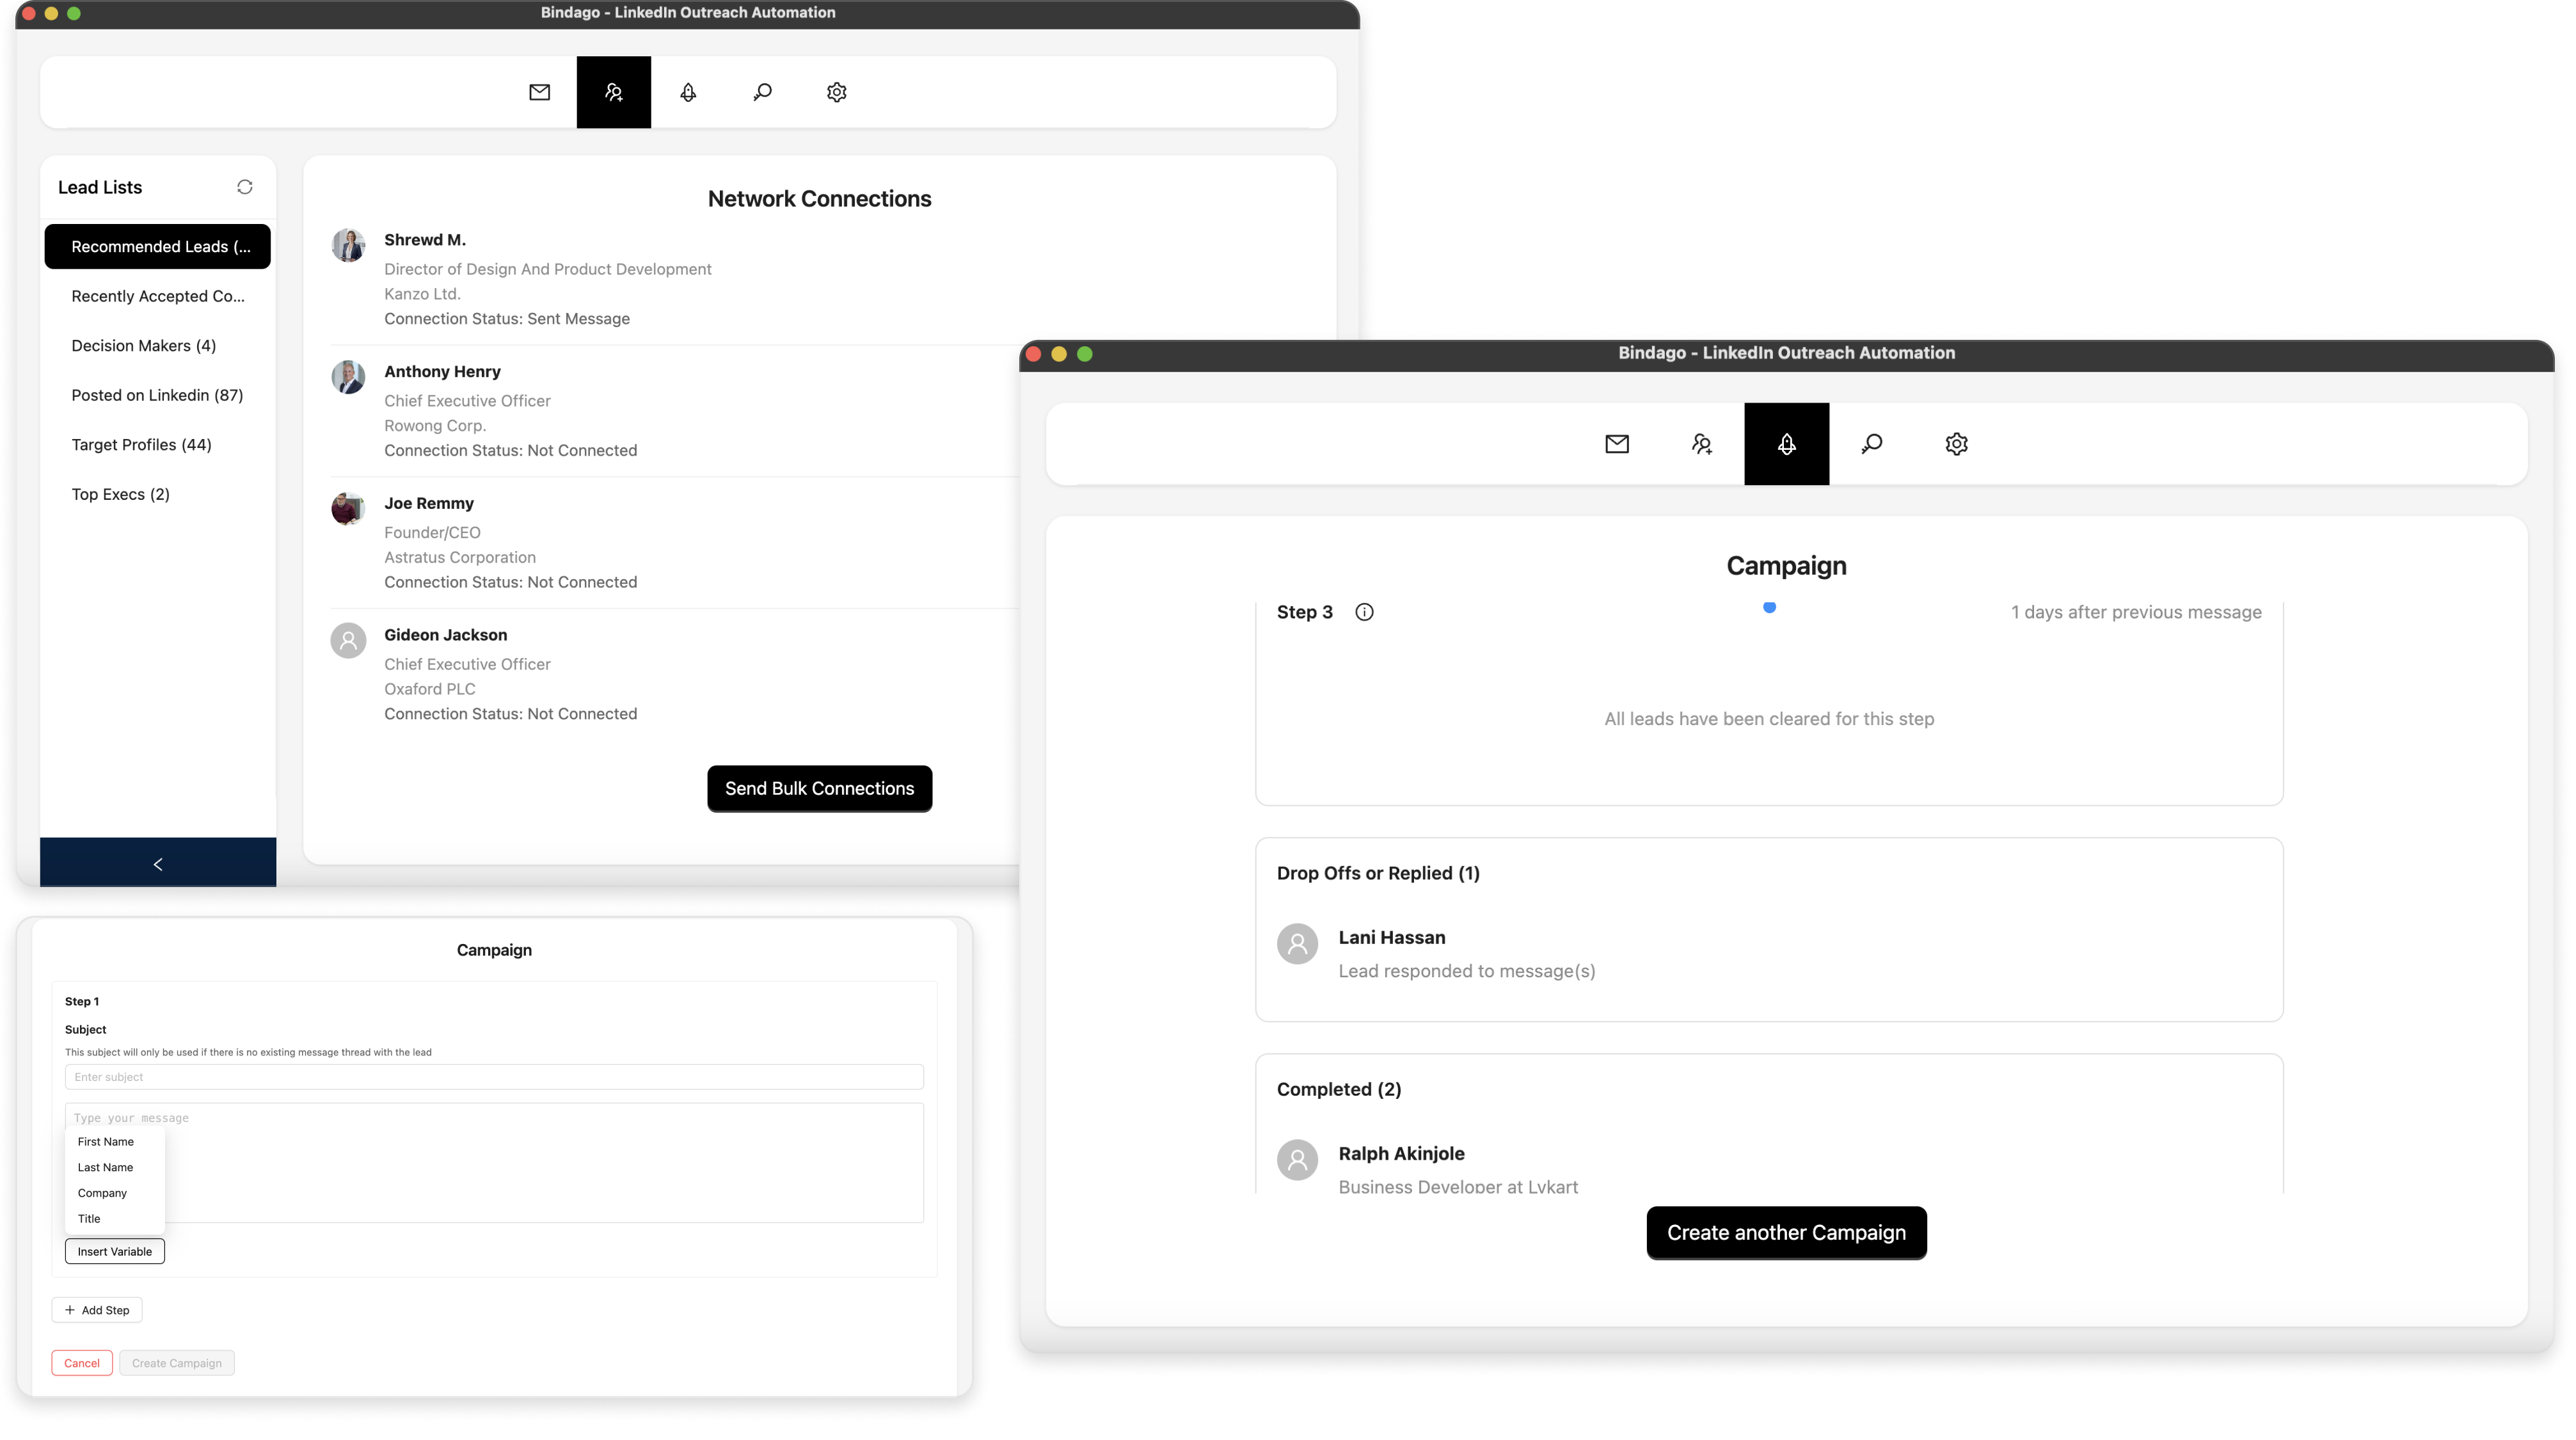
This is where a secure and powerful automation tool like Bindago becomes your engine for converting engagement into pipeline. Bindago is a desktop application that helps you automate your LinkedIn outreach safely and efficiently.
Here’s how you can use Bindago to act on your analytics:
- Identify Your Engaged Prospects: After you've identified a successful post, you have a ready-made list of warm leads: the people who engaged with it.
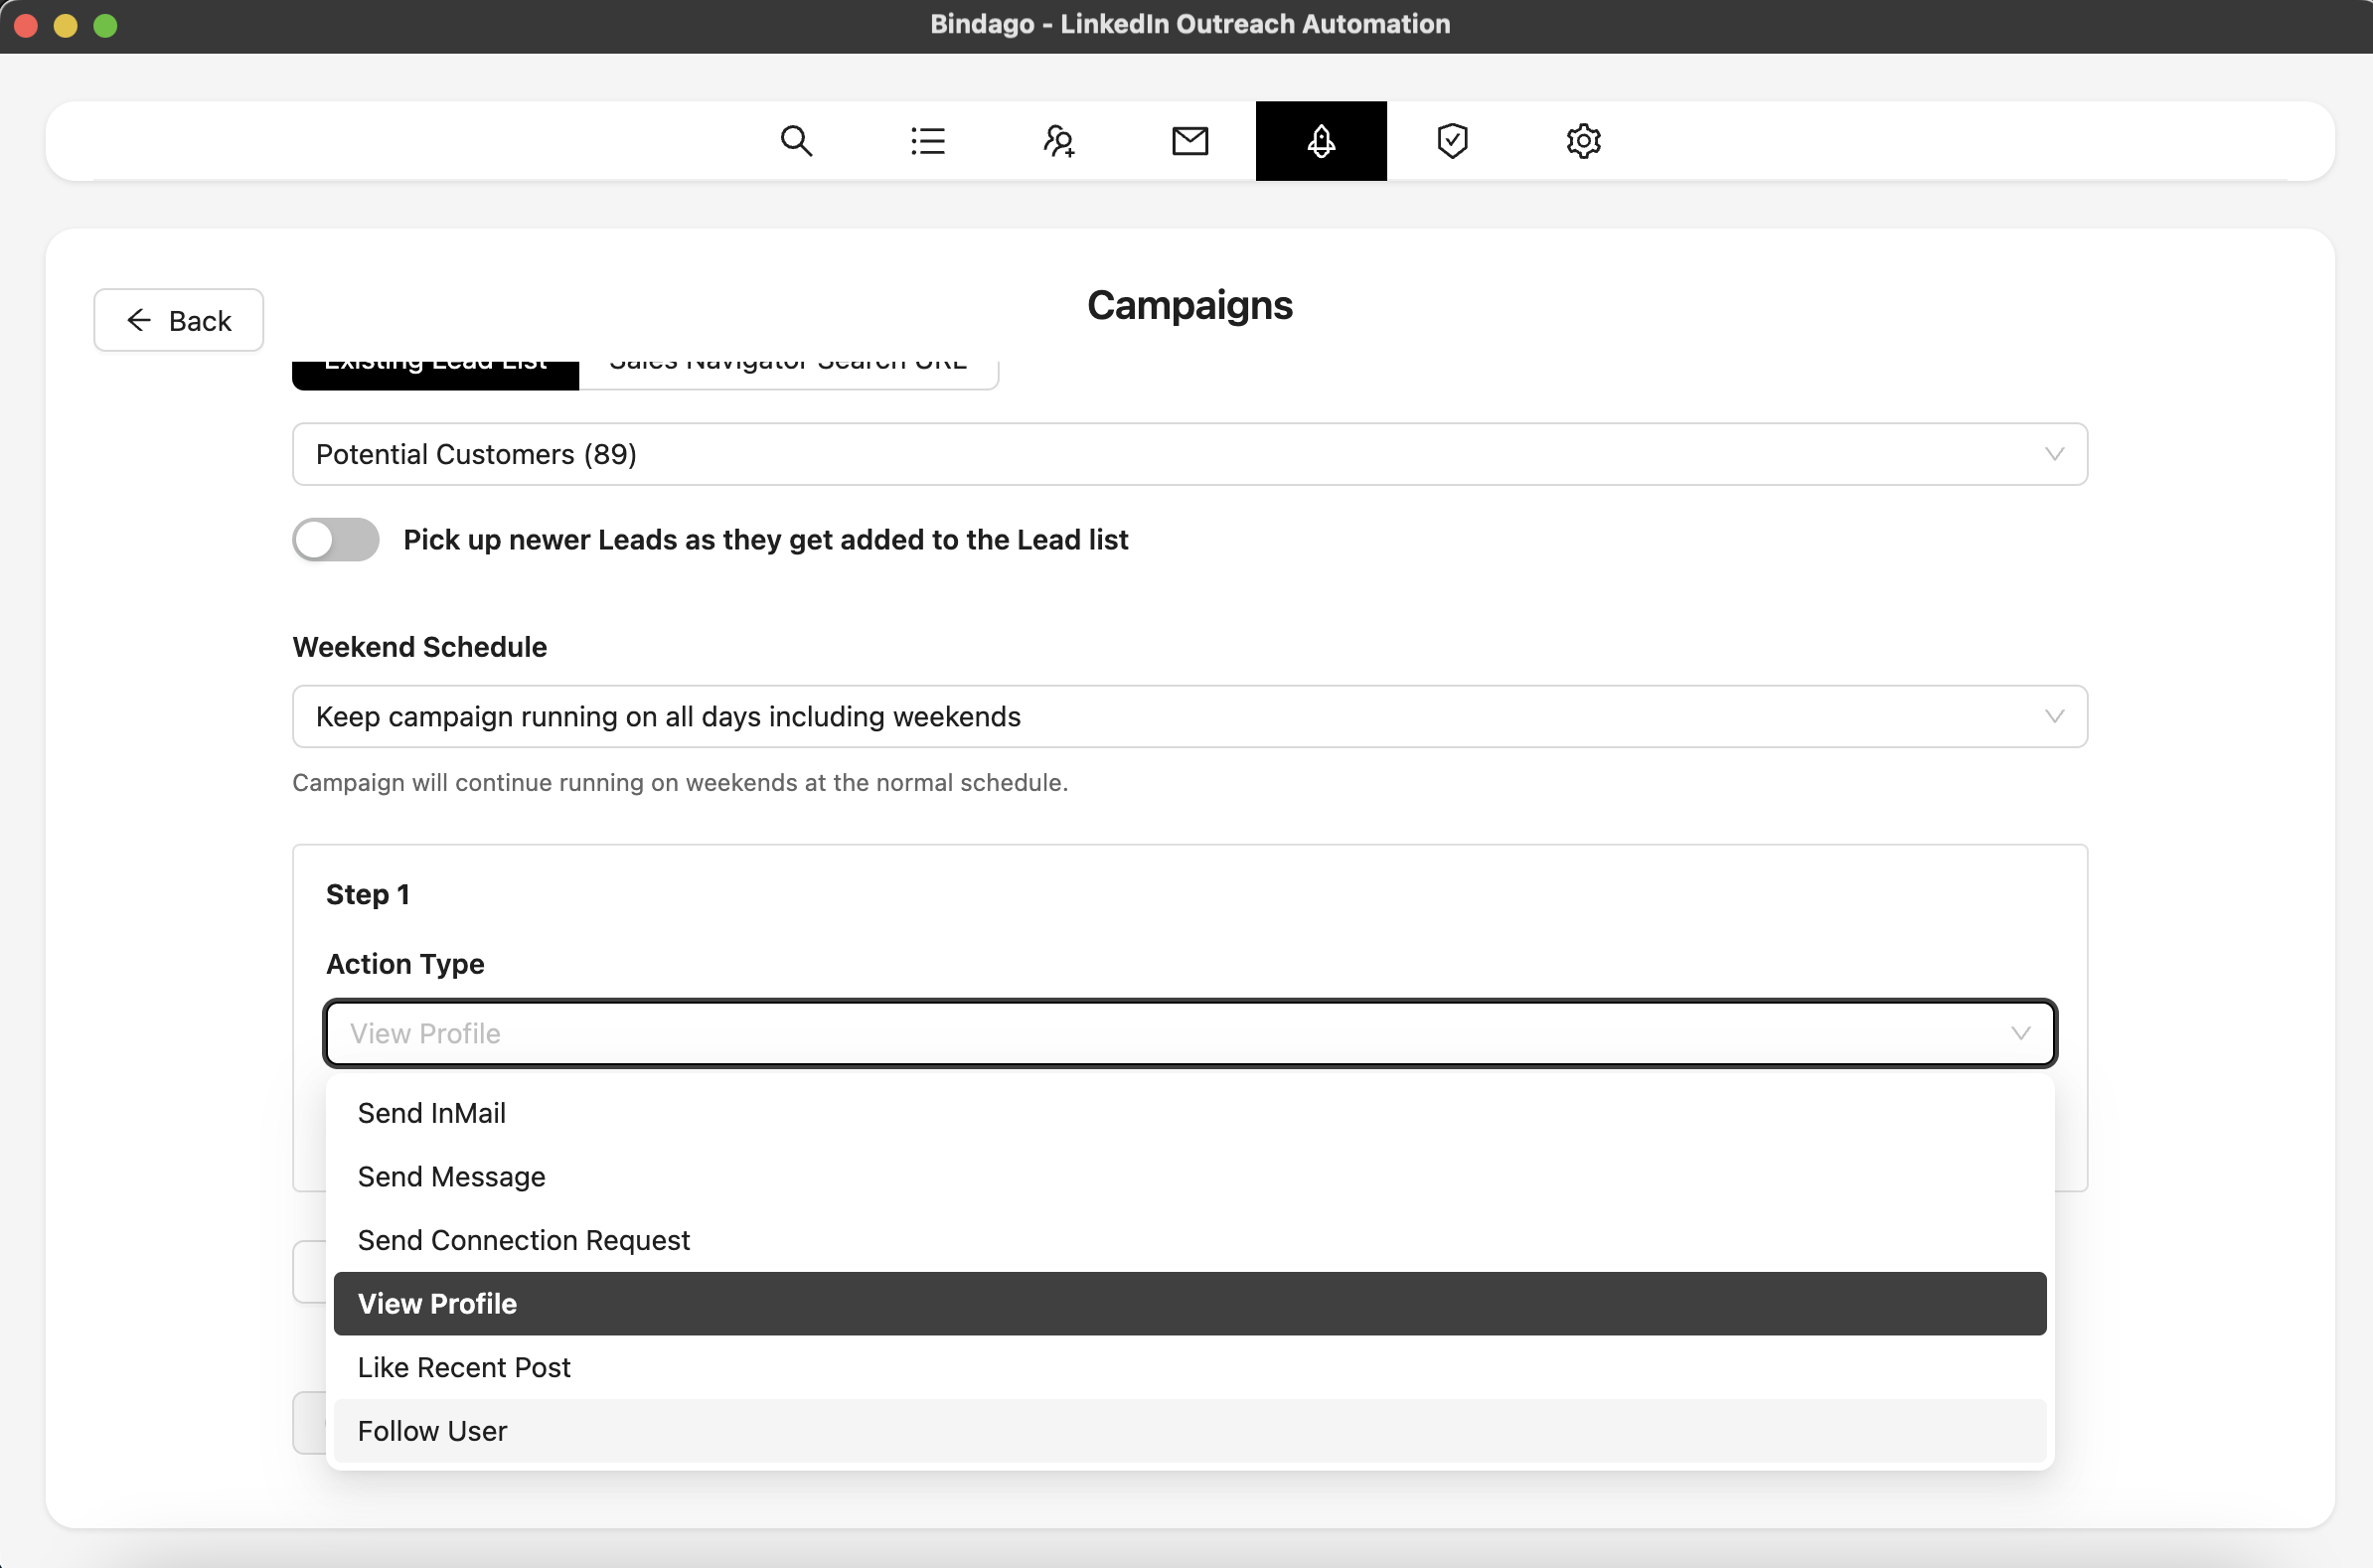
- Launch a Targeted Outreach Campaign: Create a list of these prospects and use Bindago's Campaigns feature to launch a multi-step outreach sequence.
- Step 1: Send a Contextual Connection Request.
- Template: "Hi {{firstName}}, thanks for engaging with my post on [Topic]. Since you're clearly interested in this area, I thought it would be great to connect."
- Step 2 (3 days after connecting): Send a Value-Driven Follow-Up.
- Template: "Thanks for connecting! As you're interested in [Topic], I thought you might find this in-depth guide on the subject useful. [Link to resource]."
- Step 1: Send a Contextual Connection Request.
By using Bindago to automate this process, you create a powerful system: your content attracts and qualifies leads, and your automation turns that interest into conversations. And because it's a desktop app, your LinkedIn credentials remain securely on your computer.
Conclusion: Create, Measure, Refine, Convert
A data-driven approach transforms your LinkedIn activity from a guessing game into a predictable system for building your brand and generating leads. Stop posting into the void. Start measuring what works, refining your strategy based on real data, and systematically converting your most engaged audience members into your best customers.
The process is simple:
- Create value-driven content.
- Measure its performance using LinkedIn Analytics.
- Refine your strategy to do more of what works.
- Convert your engaged audience into opportunities with a systematic outreach process.
Ready to turn your LinkedIn analytics into a predictable sales pipeline? Download Bindago today and start your 10-day free trial.